Project Description
Within the project, students study the average speed of the trip to school. Before starting the research, students formulate two clear hypotheses that can be tested through the data analysis. For example, they might predict differences in travel times depending on the day of the week or the time of day. After completing the study, they draw conclusions based on the results and reflect on the validity of their hypotheses. The main tool for data analysis in this project is descriptive statistics. Students calculate measures such as the median, quartiles, mean, and standard deviation. They also visualize the data using a box-and-whisker plot, which helps identify the spread and possible outliers in the dataset.
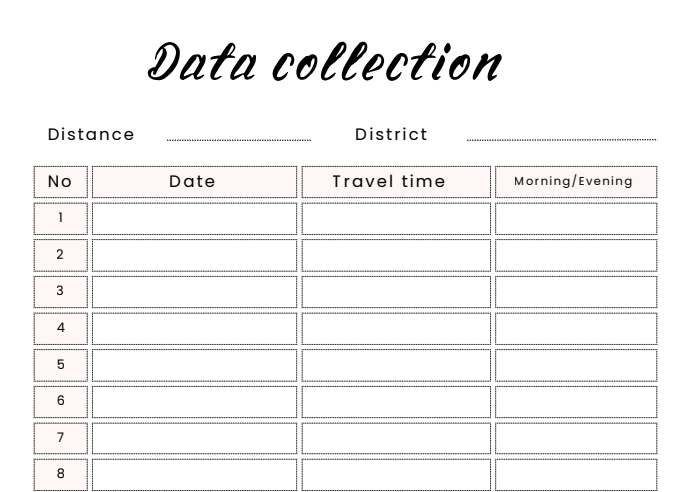
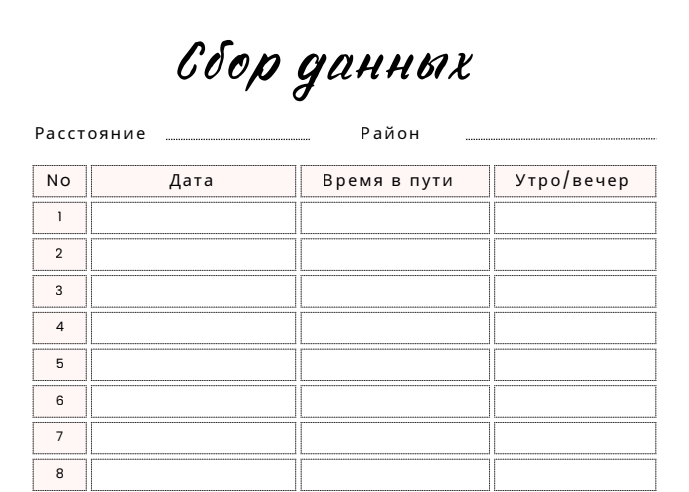
Stage 1: Data Collection
At the first stage, students collect data on travel times over a period of one to two weeks and record them in their workbooks. Ideally, the total sample size for the whole class should reach at least several hundred data points. After completing the data collection, all records must be entered into an Excel table and submitted to the teacher for review.
Stage 2: Data Analysis
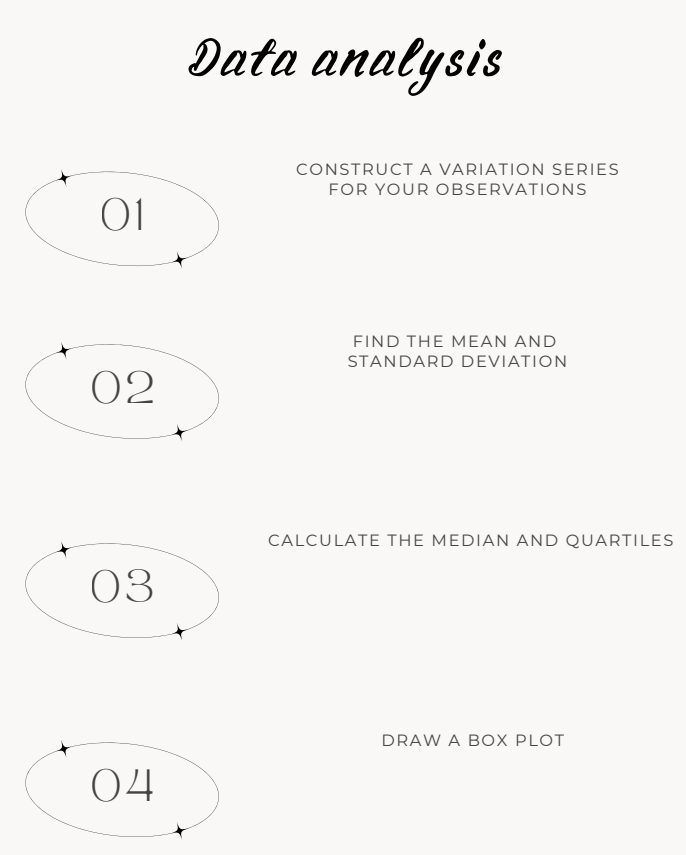
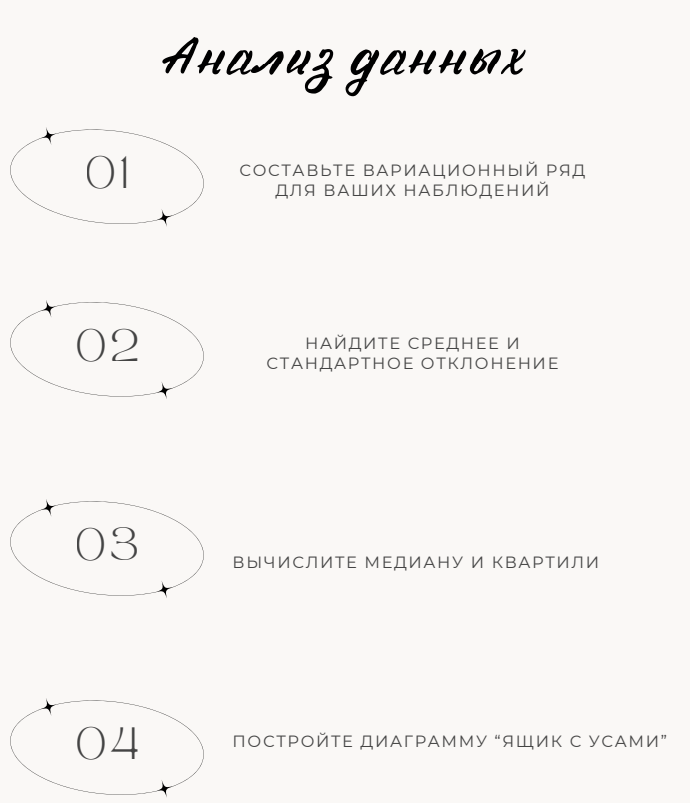
At this stage, students analyze the collected data by calculating key descriptive statistics such as quartiles, median, mean, and standard deviation. Each student should ideally have about 15–20 observations in their dataset. They then create a box-and-whisker plot to visualize the distribution of their data. The teacher collects all individual Excel files, combines them into a single dataset, and constructs an overall box-and-whisker plot for the class to compare results and discuss findings.
Stage 3: Conclusions
At this stage, students draw conclusions from their analyzed data and test their initial hypotheses. They discuss patterns and trends observed, verify if their predictions were correct, and reflect on possible sources of error or variability. The teacher guides a class discussion to summarize key insights and encourages students to consider how their findings relate to real-world situations.